Charts
- Before a chart is created (using plot(), qplot(),.. functions) setup the Graphics devices using BMP, JPEG, PNG or TIFF functions.
Click "Add output file" to insert it before the plot function in the R Script like: png("::OutputFilePng1")
- Placeholder ::OutputFilePng1 will be replaced with a temporary file path
- If you uncheck the "Enclose" checkbox only the placeholder will be pasted into the R script
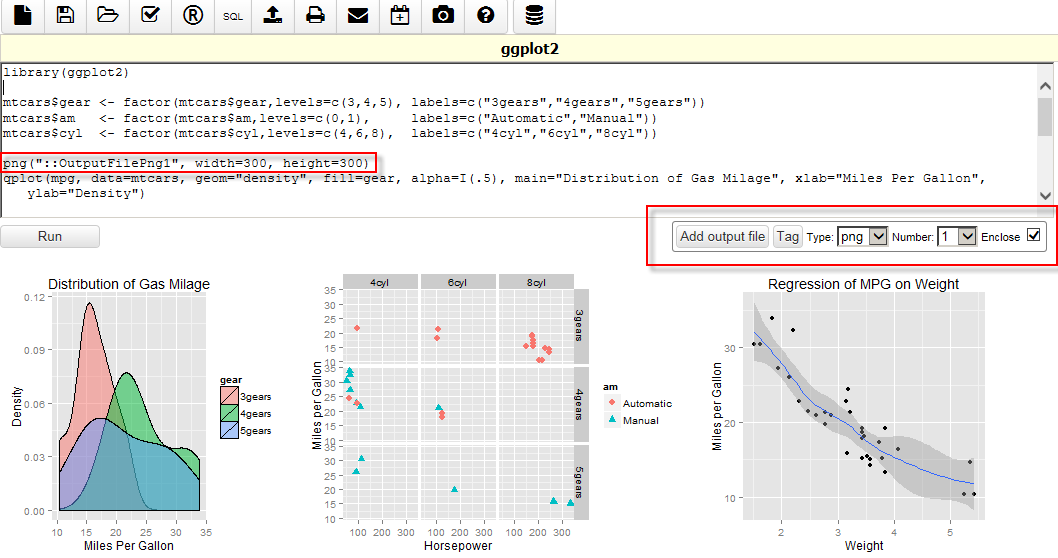
- The charts will be displayed on top before the text generated by the R script
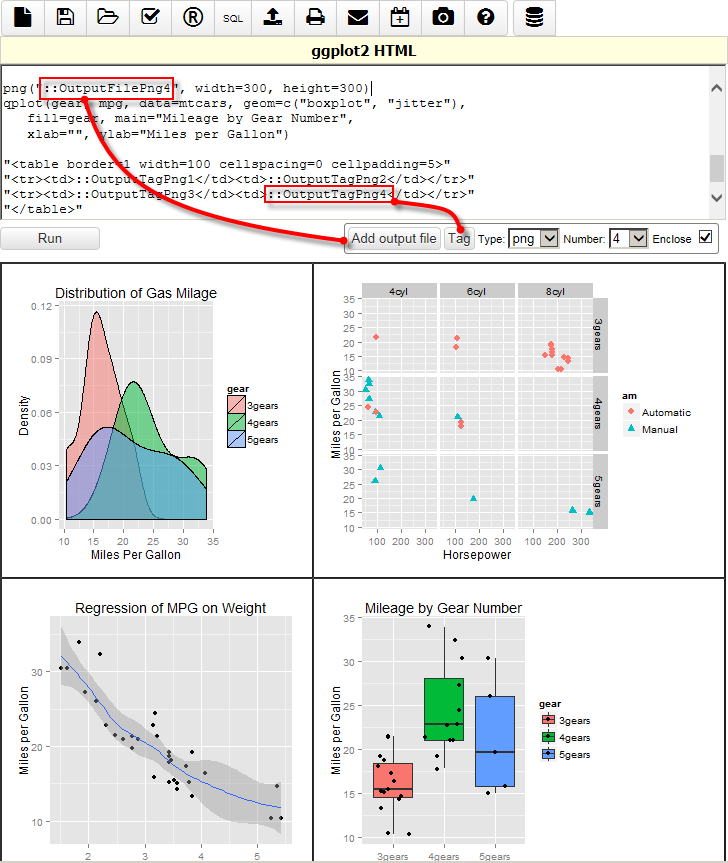
- To arrange charts using HTML, open options and for "Output type" select "HTML and Output files".
Click "Tag" button to insert the chart image tag into your HTML code like:
"<table border=1 width=100 cellspacing=0 cellpadding=5>"
"<tr><td>::OutputTagPng1</td><td>::OutputTagPng2</td></tr>"
"<tr><td>::OutputTagPng3</td><td>::OutputTagPng4</td></tr>"
"</table>"